

AMZN: The Death Star Reports
Amazon prints Q2 after the bell Thursday. The options market says ±7.2%. Here is the tape, the tactic, and the position we already hold.
The AMZN earnings options trade of the quarter lands Thursday. Amazon reports Q2 on July 30 after the close, with the call at 5:00 p.m. ET. The stock sits at $232.11 — seventeen percent below its May 6 record close of $274.99 — while forty-five of forty-six covering analysts still carry a Buy. That gap between price and consensus is the entire trade. Somebody is wrong.
Situation Report
Amazon confirmed the Q2 2026 date and 5:00 p.m. ET call on July 16. Here is the thing about this print that almost nobody is saying out loud.
The market has already taken its beating on the exact fear it is worried about again.
Rewind to February 5. Amazon posted record fourth quarter revenue, AWS accelerating to its fastest pace in thirteen quarters, and then Andy Jassy said the number that mattered — roughly $200 billion of capital expenditure planned for 2026, about $53 billion north of what the Street had penciled in. The stock lost eight percent the next session and traded down as much as ten to eleven percent after hours. It bottomed at $196.00 on February 17.
Then in April it happened in reverse. Q1 came in with AWS up 28 percent — the fastest in fifteen quarters — a record 13.1 percent company operating margin, and a revenue guide for this quarter that cleared consensus by roughly four percent. The stock opened down three percent after hours anyway, on capex and free cash flow, and then reversed and closed higher. Two prints, same fear, opposite reactions.
That is what a battle looks like when the narrative is contested. And it tells you something important: the capex fear is not new information. It is in the price. What is not yet in the price is proof of the payback.
Amazon has de-rated seventeen percent off its high into a quarter where the sell side has spent the last three weeks raising its AWS estimates. Goldman went from $325 to $335. KeyBanc went from $325 to $335. Jefferies is at $320 and points out the stock trades near twelve times forward EBITDA. Wedbush initiated with a Buy. When the tape falls while the models rise, the setup is asymmetric — but only if you structure it that way.
What Wall Street Is Modeling
| Metric | Q2 2026 Consensus | Year Ago | Implied Growth |
|---|---|---|---|
| Revenue | $196.71B | $167.7B | +17.3% |
| EPS (diluted) | $1.82 | $1.68 | +8.3% |
| AWS revenue | ~$40.5B | $30.9B | ~+31% |
| AWS operating margin | ~33.8% | 33.0% | roughly flat |
| North America revenue | ~$113.8B | $100.1B | ~+14% |
| Company guidance (given Apr 29) | $194–199B sales | Operating income $20–24B, including ~$1B of incremental Amazon Leo satellite cost | |
Consensus rating is Strong Buy: forty-five Buys, one Hold, average price target $318.98 — about 37 percent above Friday’s close. Two forecasts worth flagging because they set the whisper: TD Cowen has floated AWS growth stepping up toward 35.5 percent, and Wedbush expects management to raise capex guidance above $200 billion for 2026 and toward $266 billion for 2027.
Read those two together and you have the whole quarter in one sentence: the cloud number is likely to be good, and the spending number is likely to be bigger. Which one the tape decides to trade is the coin flip. Your job is to build a position that does not require you to call that flip correctly.
What Is Actually In Focus
1. AWS — the only line that moves the stock
AWS did $37.6 billion in Q1, up 28 percent, on a $150 billion annualized run rate, with segment operating income of $14.16 billion against a $12.84 billion consensus. The backlog was $364 billion. Consensus for Thursday is roughly $40.5 billion. Anything with a three in front of the growth rate keeps the reacceleration story alive. Anything that starts with a two — especially a decelerating two — and the capex bears own the microphone.
2. Trainium and custom silicon — the margin story
The chips business (Graviton, Trainium, Nitro) cleared a $20 billion annual run rate in Q1 growing at triple digits. Jassy has said the silicon business would be worth $50 billion as a standalone. This matters for one reason: every AI workload Amazon runs on its own chips instead of buying merchant silicon shows up as AWS margin. That is why AWS operating margin, not AWS revenue, is the tell Bank of America has told clients to watch.
3. Advertising — the quiet compounder
$17.24 billion in Q1, up 24 percent, beating the 21.2 percent the Street modeled. It is now larger than YouTube. It is close to pure margin. Another quarter above twenty percent growth and it becomes very hard to argue Amazon is a low-multiple retailer.
4. Capex and free cash flow — the bear case, unchanged
Capex was $43–44 billion in Q1 alone. Trailing twelve month free cash flow collapsed to $1.2 billion from $25.9 billion. Moody’s put out a note on July 24 flagging AI spending as a credit quality issue for Amazon, Meta, and Alphabet. If management raises the 2026 capex number again without giving the Street a credible utilization or payback timeline, the February tape is the template.
5. Prime Day, Leo, and the housekeeping
Prime Day moved into the June quarter this year, which is a real revenue tailwind that was not in last year’s Q2 — Goldman noted Prime Day sales up 9.5 percent year over year. Against that, roughly $1 billion of incremental Amazon Leo satellite cost is baked into the operating income guide ahead of the planned Q3 commercial launch. Do not confuse either one with underlying trend.
Q1’s headline EPS of $2.78 against a $1.64 estimate was a 70 percent “beat.” It included roughly $16.8 billion in pre-tax gains on Amazon’s Anthropic investment. Operating income — the number that reflects the actual business — was $23.9 billion. When Thursday’s headline crosses, look at operating income and AWS first. Headline EPS at Amazon is noise more often than it is signal.
The AMZN Earnings Options Trade: What The Market Is Pricing
The at-the-money straddle covering Thursday’s report is pricing an expected move of roughly ±7.2 percent. On a $232.11 close that is about $16.70 in either direction.
| Options Market Read | Level | What It Means |
|---|---|---|
| Implied move (1 std dev) | ±7.2% | Roughly ±$16.70 |
| Upside boundary | ~$249 | Beyond this, call buyers get paid |
| Downside boundary | ~$215 | Below this, February repeats |
| 10-year average move | ±7.4% | Options priced essentially at history |
| 10-year median move | ±7.2% | Dead on the median. No vol edge. |
| 95th percentile tail | ±13.7% | Your realistic worst case: ~$200 or ~$264 |
| Beat rate (last 15 reports) | ~60% | Actual has exceeded implied 9 of 15 times |
Read that table one more time, slowly, because it is the most useful thing on this page.
The market is charging you the ten-year median for this move. Not a premium. Not a discount. The straddle is fairly priced. That means there is no edge in simply being long volatility or short volatility here — the vol seller and the vol buyer are both taking a fair-odds bet, and after commissions and slippage a fair-odds bet is a losing bet.
The mild historical tilt — a 60 percent beat rate, meaning the actual move has cleared the implied move nine of the last fifteen quarters — leans buyer-friendly. But sixty percent is a lean, not a signal. You do not build a position around a lean. You build it around structure.
When implied equals realized history, the edge is not in whether you own premium. It is in how you own it. Every dollar of implied volatility you pay for on Thursday afternoon is a dollar that evaporates Friday morning — that is the IV crush, and it is the single most reliable thing about earnings week. So do not buy a naked option. Own the direction and sell someone else the crush.
Earnings History — What Actually Happened
Four quarters, four different reactions. Study the pattern, because the pattern is the point — the same way we break down every position in our published trade alerts.
| Report | EPS (Act / Est) | Revenue | AWS | Stock | Why |
|---|---|---|---|---|---|
| Q2 2025 Jul 31, 2025 |
$1.68 / $1.33 Big beat |
$167.7B vs $162.1B |
$30.9B +17.5% |
−8.6% | Beat on everything, then guided Q3 operating income to a low end below consensus. AWS at 17.5% looked slow next to Azure’s 39% and Google Cloud’s 32%. |
| Q3 2025 Oct 30, 2025 |
$1.95 / $1.57 Big beat |
$180.2B vs $177.8B |
$33.0B +20.2% |
+13% AH ~+9.6% close |
AWS reaccelerated to its fastest pace since 2022 and blew past the 18.1% expected. The single cleanest AWS-driven rally of the cycle. |
| Q4 2025 Feb 5, 2026 |
$1.95 / $1.97 Slight miss |
$213.4B vs $211.3B |
$35.6B +24% |
−8% (−10–11% AH) |
Record revenue, fastest AWS in 13 quarters — irrelevant. The $200B capex guide came in roughly $53B above the Street and the stock was cut in half a session. |
| Q1 2026 Apr 29, 2026 |
$2.78 / $1.64 70% beat* |
$181.5B vs $177.3B |
$37.6B +28% |
−3% AH reversed, closed +0.8% |
Best operating quarter Amazon has ever printed — record 13.1% margin, 15-quarter high AWS. Market shrugged: FCF at $1.2B TTM and $44B of quarterly capex. |
*Q1 2026 EPS included roughly $16.8B of pre-tax gains on the Anthropic investment. Operating income was $23.9B.
In three of the last four quarters Amazon beat on revenue and beat on AWS — and the stock fell in two of them. Amazon does not trade on the quarter. It trades on the guide and on capex. Anybody buying a call Thursday afternoon because they think the quarter will be good has already made the mistake. The quarter will probably be good. That was never the question.
The Level Map
| Level | Significance |
|---|---|
| $278.56 | 52-week high. The number the bull case has to eventually reclaim. |
| $274.99 | All-time closing high, May 6, 2026. |
| $270 | Pre-selloff shelf. Also the strike of our synthetic long in the model portfolio. |
| $249 | Top of the implied move. Clearing and holding it makes the February drawdown a memory. |
| $232.11 | Friday’s close. Roughly $2.50 trillion of market cap. |
| $215 | Bottom of the implied move. First real test. |
| $196.00 | 52-week low, set February 17 during the capex panic. The 95th-percentile tail lands here. |
The Position We Already Hold
Before we talk about a new tactic, here is the AMZN position sitting in the model portfolio right now — and, more importantly, why it is built the way it is. Screenshots straight off the platform, no editing.
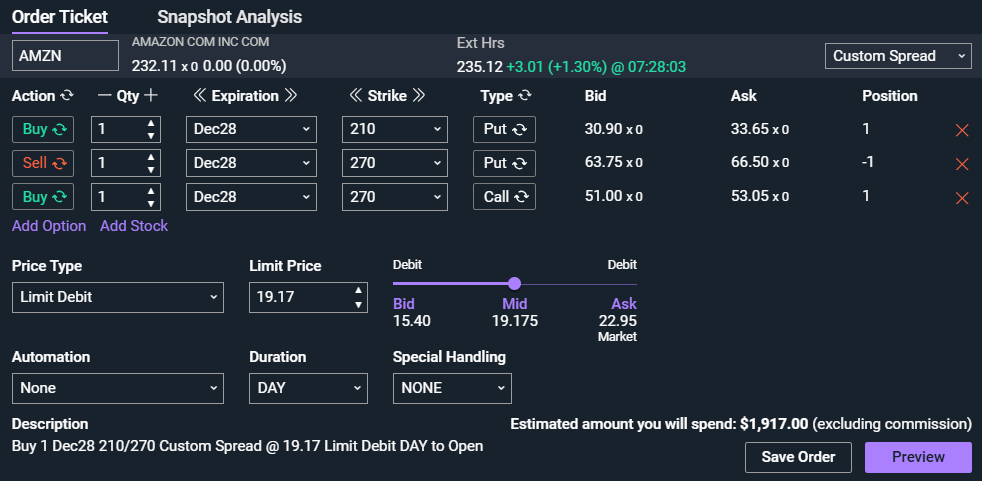
Order ticket: three legs, one December 2028 expiration, $19.17 net limit debit — $1,917 to control 100 shares of a $2.5 trillion company.
Position Anatomy — AMZN Dec 2028
Strip it down and there are only two ideas in that ticket.
Idea one: the short 270 put plus the long 270 call is synthetic long stock. Those two legs together behave exactly like owning 100 shares from $270 — identical profit and loss, dollar for dollar, in both directions. And because AMZN’s December 2028 270 put was bid at $63.75 while the 270 call was offered at $53.05, that pair of legs was put on for a credit of roughly $13. The market paid us to be long the stock.
Idea two: the long 210 put is a hard floor. That is the whole reason the position costs anything at all — roughly $32 of the outlay. It converts a position with unlimited downside into one where the loss stops at a known number, permanently, for the next twenty-nine months. No stop loss to get gapped through. No margin call at 4:01 p.m. on Thursday. A structural floor.
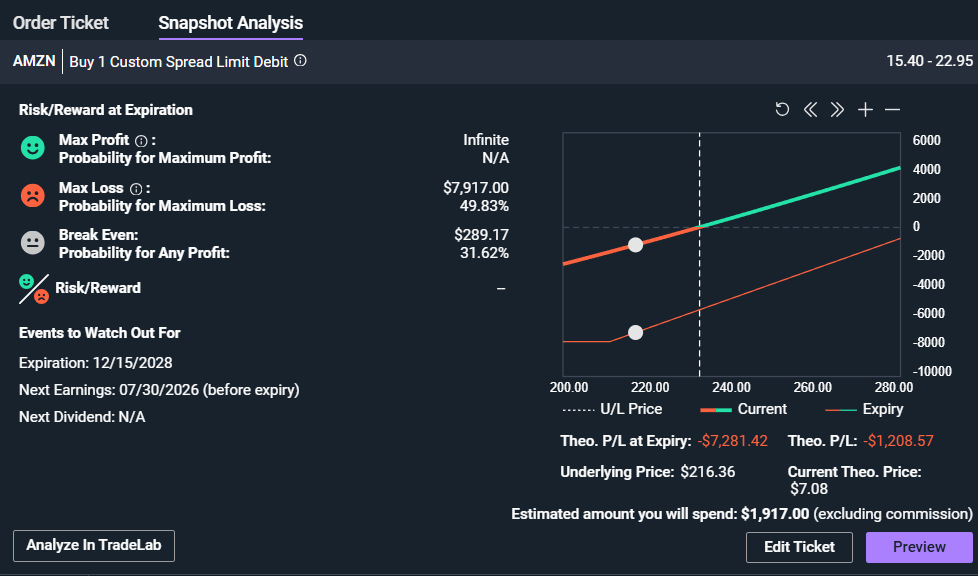
Risk/reward at expiration: max loss $7,917, break-even $289.17, upside unlimited. Note the platform is modeling the underlying at $216.36 — the live tape is $232.11, and $235.12 in Monday pre-market. The static screenshot understates where this position actually sits.
| Metric | This Position | Buying 100 Shares |
|---|---|---|
| Cash out of pocket | $1,917 | $23,211 |
| Maximum possible loss | $7,917 (capped) | $23,211 (to zero) |
| Upside | Unlimited above $289.17 | Unlimited above $232.11 |
| Break-even at expiration | $289.17 | $232.11 |
| Time to work | Dec 15, 2028 — ~29 months | Forever |
| Earnings reports before expiry | Nine. Thursday is the first of nine. | |
Nine earnings reports stand between here and December 2028. This position is not a bet on a quarter — it is a bet on the capex cycle converting to cash flow, which is a two-to-three year proposition by definition. The floor is already installed at $210. Trading a twenty-nine month thesis around a twelve-hour headline is how good positions get destroyed by their own owners. We hold. That is the discipline.
The Tactic
Three decisions here, and the third one matters as much as the first two.
Primary — The offensive sortie
AMZN September 18, 2026 — buy the 240 call, sell the 270 call.
A thirty-point-wide call vertical. Maximum value $3,000 per spread. Work it at the mid; do not pay more than $10.00 — above that the risk-reward drops under two-to-one and the trade is no longer worth the ticket.
| Structure | Detail |
|---|---|
| Legs | Long Sep 18 $240 call / Short Sep 18 $270 call |
| Maximum debit | $10.00 — work the mid, walk away above it |
| Maximum value | $30.00 ($3,000) |
| Maximum loss | The debit paid. Nothing more. Ever. |
| Break-even | Roughly $249–$250 — the top of the implied move |
Why a spread and not a call. Buy a naked September 240 call Thursday afternoon and you pay Thursday afternoon’s volatility. Friday morning that volatility is gone whether you were right or wrong — that is the crush. In a vertical, the short 270 call was sold at the same inflated volatility you paid on the 240. When it crushes, both legs deflate together and the spread barely notices. You have neutralized the one thing that reliably beats retail traders in earnings week.
Why September and not August. Two reasons. The August contract makes you right in about seventy-two hours or not at all. September gives the post-earnings drift — the tendency of a stock to continue in the direction of its earnings surprise — roughly seven weeks to work. And it means the position is still alive when the Street has had a full quarter to digest whatever capex number lands on Thursday.
Why the 270 strike. Because that is the pre-selloff shelf, it is inside the all-time high, and it is the exact level where we already have a synthetic long working. We are selling the price at which we would be perfectly content to be flat.
Defensive — Protect the core through the print
AMZN August 21, 2026 — buy the 215 put, sell the 195 put. Target $2.00 to $3.00.
This is for anyone carrying the long-dated synthetic. Yes, there is a 210 put in that structure. But a put with twenty-nine months of life on it does not move dollar-for-dollar in a fast break — it moves at a fraction, because most of its value is time, not direction. A front-month 215/195 spread moves close to one-for-one through exactly the zone that hurt us in February.
Cost is roughly one percent of the $23,000 of stock exposure you are carrying. If AMZN rips, you lose the debit and you will not care, because the core made multiples of it. That is what insurance is supposed to feel like.
What we are deliberately not doing
No naked short puts. Not into a capex guide. February gapped ten percent after hours with no chance to manage. Selling undefined downside for a fixed credit into a known binary event is how accounts die.
No straddle or strangle. Implied is ±7.2%. The ten-year median is ±7.2%. You are being asked to pay exactly fair value for a coin flip and then pay commissions on top. Pass.
No touching the December 2028 core. Covered above. Nine more reports. Hold.
Execution Discipline
| Rule | Standard |
|---|---|
| Max loss first | Before you look at a single profit number, look at the max loss and ask whether you are comfortable eating it in full. If the answer is no, the size is wrong — or the trade is. |
| Size to the loss, not the win | The maximum loss on every structure above is a fixed, knowable dollar figure. Size so that number sits inside your per-trade risk limit. Then it does not matter what happens Thursday night. |
| Entry window | Wednesday or Thursday. Volatility is still rising into the bell, so earlier is cheaper — but liquidity and spreads are best midweek. Work the mid. Never pay the ask on a multi-leg order. |
| Taking profit | Scale. First tranche off if the vertical doubles. Balance at roughly 80 percent of max value. Do not grind for the last dollar in a spread — that dollar costs you weeks of exposure for pennies of return. |
| Eject | If AMZN closes below $215 on the session after the report, the up-thesis is broken for this window. Take what is left of the debit off the table and stand down. There will be another sortie. |
| Pigs get slaughtered | You will be tempted to hold the whole spread for the full $30. Most traders who do that end up with zero. Take the money. |
The Debrief
Amazon is going to report a good quarter. AWS is accelerating, advertising is compounding above twenty percent, and the company just printed the highest operating margin in its history. None of that is in dispute.
What is in dispute is whether $200 billion — or $266 billion — of annual capital expenditure is a moat being dug or a hole being fallen into. Thursday will not settle that argument. It will only move the tape.
So we are not trading the argument. We hold a defined-risk synthetic long with a floor at $210 and twenty-nine months to be right about the cycle. We add a defined-risk call vertical that pays if the Street decides the cloud number is enough. We buy cheap, defined-risk downside for the week the headline hits.
That is what separates an AMZN earnings options trade from a lottery ticket: every structure on this page has a maximum loss we wrote down before we entered.
That is not caution. That is how you stay in the fight long enough for the thesis to pay you.
Get The AI Infrastructure Supercycle Report
AMZN is one of ten names in the AI Infrastructure Supercycle Report — the full institutional breakdown of the buildout, the silicon, and the tickers positioned to own it. Plus the Bullish on ‘Merica SPX LEAPS Report. Both delivered instantly, at zero cost.
Get Both Reports FreeThere’s a winner and there’s a loser. What side are you on?
Fight’s On,
Matthew “Whiz” Buckley
CEO, TOPGUN Options | Wall Street Managing Director | TOPGUN Fighter Pilot
President, No Fallen Heroes Foundation | Founder, Sacred Warrior Fellowship


